The Pontiac platform features a robust reporting dashboard with all the data and visualizations needed to seamlessly analyze campaign performance and maximize returns on your ad spend. Quickly see campaign stats such as delivered impressions, clicks, and conversions by domain, exchange, geo and more, to make informed optimizations and create actionable insights.
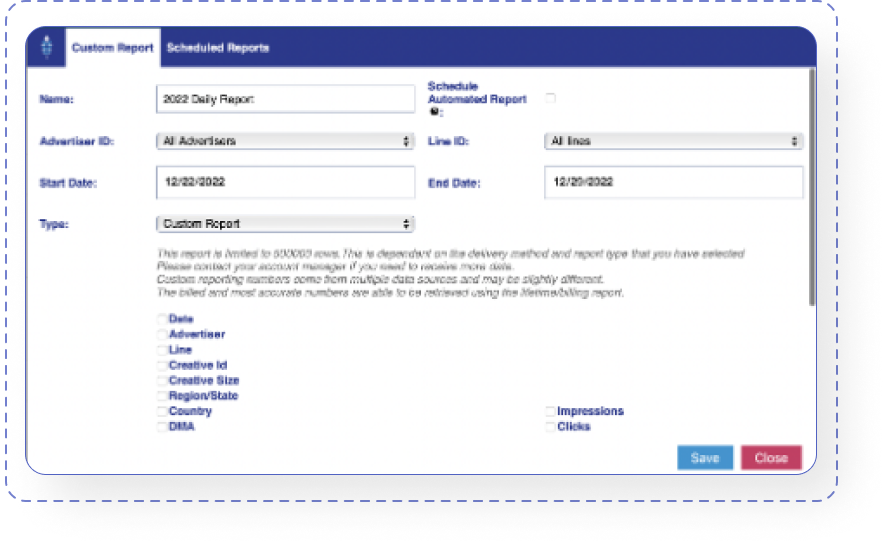
For a deeper dive into the data, use the custom reporting feature to create tailored reports with the exact dimensions and metrics to home in on your key performance indicators. Schedule custom reports to be delivered by email address or FTP at regular intervals to effortlessly track campaign progress or integrate performance data into other applications or dashboards.